Robust and Diverse M&A Market in Northland Region Since Recession
by Bill Jarrett
Managing Director, TrueNorth Capital Partners
The national M&A market has rebounded strongly from the cyclical downturn of the Great Recession. In the 2010-2015 period, national transaction volume increased at a compounded annual growth rate (“CAGR”) of approximately 9.5%. Meanwhile, M&A multiples have returned to the historically high levels reached prior to the Great Recession. Such vitality in the M&A market during the recent cyclical recovery is in stark contrast to the relatively slow growth experienced in the overall economy.
In part, the relatively rapid growth of the M&A market can be attributed to the rebound from the deep cyclical low created by the Great Recession. In 2010, corporate earnings were down, valuation multiples declined, and the availability of transaction financing was limited. Owners either couldn’t sell their companies during, or just after, the Great Recession or elected to defer any contemplated sale processes until better market conditions prevailed. With the return of attractive market conditions, and with the continued strong demand for corporate acquisitions by strategic and financial buyers, sale transactions increased rapidly as deferred sellers created by the Great Recession finally entered the M&A market and thereby augmented the size of the post-recession M&A market.
In addition to the deferred-sale effect, the recent growth rate of the M&A market was augmented by owners’ fears of another cyclical downturn. Owners of middle-market companies represent a large pool from which only a small proportion choose to sell their companies in any given year. Certainly, during the current cyclical upturn, an increasing proportion of owners – many of whom may be aging baby-boomers – decided to take advantage of the favorable market conditions and entered their companies into sale-transaction processes earlier than they might otherwise have done. These deferred-sale and cycle-fear effects combined to help create a relatively strong growth rate in the national M&A market since 2010.
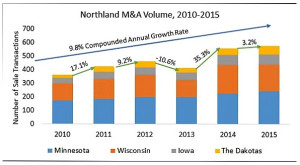
 In comparison to the strong growth of the national M&A market, the Northland regional M&A market has done even better with a 9.8% five-year CAGR. Moreover, whereas national transaction volume in 2015 was flat or slightly down, the Northland’s 2015 transaction volume increased year-to-year by 3.2%. These relatively strong growth rates were achieved in the Northland despite the 7.5% year-to-year decline during 2015 of Wisconsin-based M&A sales.
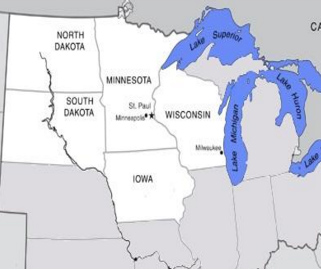
The geographic and economic diversity of the Northland Region. The Northland region is herein defined as the five states centered around the Twin Cities (Minneapolis/St. Paul) of Minnesota, which also is home to the Ninth Federal Reserve District (which covers a similar but larger geographic area than the Northland). Within this Northland region – (in clockwise order) Minnesota, Wisconsin, Iowa, South Dakota, and North Dakota – there is substantial diversity with respect to M&A transaction volume and growth as one moves across the region.
This diversity in the M&A markets of the states comprising the Northland is not unexpected as this region straddles very different economies, stretching from the forested Great Lakes region of Wisconsin and eastern Minnesota to the grassy Great Plains region of North and South Dakota. In between the Lakes and Plains regions are the prairie lands of western Minnesota and Iowa.
 Going back in history, the geology of the eastern Northland drove the relatively strong population growth and economic development of Minnesota and Wisconsin. These states, with access to the navigable waters of the Great Lakes and the Mississippi River, became shipping points for the Region’s production of grain, minerals, lumber, and livestock. Around these shipping points developed the two largest, by far, urban areas in the Northland – the Milwaukee-Chicago corridor and the Twin Cities. These cities developed the critical mass of capital, management, labor, and consumer demand to drive population growth, economic activity and wealth, and entrepreneurship in the eastern Northland.
The Mississippi River roughly divides the Northland’s eastern and western halves (as well as its Great Lakes and Great Plains geological regions). Minnesota’s Twin Cities, Minneapolis and St. Paul, are located on either side of the Mississippi River – where the river’s descent is relatively steep. Here, the fast-moving river powered great milling operations, which gave rise to what became the Fortune 500 companies, General Mills and Pillsbury (now owned by General Mills). Other large companies sprouted from the fertile geography and economy of Minnesota, which has long been the home to more Fortune 500 companies per capita than any other state. Minnesota’s largest companies are diverse, ranging from those with their roots in the agriculture and mining economies (Cargill, 3M, General Mills, Hormel, CHS, and Land O’Lakes) to finance/insurance (United Health, US Bancorp, and Thrivent), to retail (Target, Best Buy, and Supervalu) to healthcare and medical devices (the Mayo Clinic, Medtronic, and St. Jude) and other industry leaders (CH Robinson, Honeywell, and Ecolab).
Wisconsin and Minnesota have very similar populations of 5.8 million and 5.5 million, respectively. The stronger corporate environment around the Twin Cities, however, is probably an important factor in the relatively high per-capita income in Minnesota versus Wisconsin. Reportedly, the median household income in Minnesota and Wisconsin is $58,906 and $47,220, respectively – nearly a 25% difference.
In contrast to the Northland states bordering the Great Lakes, the other Northland states, consisting of Iowa and the Dakotas, have much smaller populations, economies, and M&A markets. Also, they are much more dependent on the agricultural economy, although North Dakota has become more dependent on the energy economy as a result of the tremendous development of this state’s fracking industry.
 Northland’s pronounced M&A growth variance and volatility. As seen in the nearby chart, Minnesota and Wisconsin, with 2015 corporate sales numbering 243 and 197, respectively, account for three-quarters of the Northland’s sell-side M&A activity. The Dakotas, with combined 2015 corporate sales of 65, have the smallest market share, but have substantially increased their share of the Northland market since 2010.
 With its leading market share, Minnesota has demonstrated the most consistent, but also the least rapid, growth of the five states. Between the eastern and western halves of the Northland, there has been a substantial difference in state M&A market growth rates. The two most-western states of South and North Dakota experienced exceedingly strong growth, with a combined five-year CAGR of 22.1% and a 2015 year-to-year growth rate of 30.0%. In comparison, the other three states to the east of the Dakotas have experienced five-year CAGRs ranging from 7.2% to 12.8%. In 2015, the year-to-year growth in Minnesota M&A activity of 8.5% offset the 7.5% decline in Wisconsin M&A activity, while Iowa’s M&A activity was flat.
The extraordinary growth rates of the Dakotas can be largely attributed to two factors: 1) as a result of the Great Recession, the two states had a combined low base of M&A volume (just 24 reported transactions in 2010) upon which to grow, and 2) these states are largely dependent on the agricultural and, increasingly, the energy markets, both of which have rebounded and shown volatility since the Great Recession. Volatile markets often lead to increased deal activity, as owners either seek to take advantage of attractive market conditions or are compelled by poor market conditions to enter into a transaction. Given the Dakotas’ relatively small size of their combined M&A market and dependence on volatile markets, it’s understandable to see such rapid growth in the Dakotas’ M&A volume during the recent recovery from the Great Recession. For these same reasons, and given the recent declines in agricultural and energy prices, it also would be understandable to see continued growth volatility in the Dakotas in 2016 and beyond.
By the way, the only year of volume decline since 2010 for the Northland region was 2013. In part this can be attributed to the change in tax laws that took effect in 2013. The effect of these tax law changes, including an increase in capital gains taxes, was a rush to complete transactions in 2012. Thus, transactions that would ordinarily have closed in 2013 were completed in 2012, thereby augmenting the 2012 year-to-year growth rate and reducing the 2013 year-to-year growth rate from the high, tax-driven level of transactions in 2012.
Sales of companies in the business services & distribution sector have driven growth in the Northland region’s M&A market. At TrueNorth (www.truenorthcp.com), we segregate the universe of middle-market companies into three broad sectors: business services & distribution (“B&D”), industrial & manufacturing (“I&M”), and consumer & retail (“C&R”), and “Other” (which includes financial, real estate, and other companies outside our three main sectors). Within the Northland region, the largest sector in terms of M&A transaction volume is the B&D sector. Over the past five years this sector accounted for 40% of corporate sales. In comparison, the I&M sector (25%) and the C&R sector (15%) had substantially less corporate sales.
Over the past five years, the largest sector, B&D, also experienced the fastest growth with a five-year CAGR of 13.9%. Next in terms of transaction volume growth is the smallest sector, C&R, with a five-year CAGR of 13.8%. The I&M sector is a distant third, with a five-year CAGR of just 5.6%. The broad-based weakness of the industrial and manufacturing sector, in terms of corporate growth and profits, may be the cause for this sector’s relatively slow annual growth rate in corporate sales as owners seek to sell off of stronger earnings and prospects.
The diverse buyers of Northland-based companies. Based on the available data over the past five years, several interesting observations can be made with respect to the locations and types of buyers of Northland companies:
- Most buyers of Northland-based companies are corporations based outside of the region. This is particularly true for the sale of larger companies and those companies located in the western part of Northland (in which are based relatively few strategic or financial buyers).
- In all states but South Dakota, 6% to 8% of the corporate sales in the 2010-2015 were to foreign buyers.
- In South Dakota, foreign buyers have only accounted for 2% of M&A transactions since 2010.
- Canadian buyers are particularly active in North Dakota (with its long shared border with Canada), accounting for 7% of the acquisitions in this state since 2010.
- Financial buyers, which consist primarily of private equity firms and the companies owned by private equity groups, have significantly increased their share of acquisitions in the Northland – particularly in the past two years.
- Still, the bulk of all acquisitions in the Northland, as well as the nation, involve strategic buyers.
Looking forward, as goes Minnesota so goes the Northland. As the saying goes, “no markets grow to the sky”. So, the strong five-year growth rates of the M&A markets in the Northland and the nation as a whole will subside. Indeed, we’ve already seen much slower growth and even declines in 2015 M&A markets. For the two months of 2016, M&A transactions are down on a year-to-year basis. Eventually our economy and M&A markets will experience a cyclical downturn – hopefully one less severe than the Great Recession. Obviously, market conditions and the status of economic cycle will continue to drive the M&A market in the Northland Region.
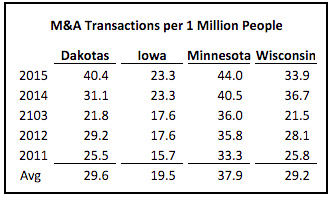
 Outside of these macroeconomic factors, it appears that the relatively large, diverse economy and M&A-intensive market of Minnesota will drive the Northland’s M&A market. The greater M&A market intensity of Minnesota is reflected by the nearby table that shows consistently higher levels of Minnesota-based sale transactions on a per-capita basis.
Year-in and year-out, the number of corporate sales per capita in Minnesota exceeds, usually substantially so, the per-capita results for the region’s other states. Part of the explanation for this greater M&A intensity might be Minnesota’s aforementioned corporate environment and the entrepreneurship it has fostered in the Twin Cities and beyond. With entrepreneur activity there must be liquidity events, i.e., entrepreneurs eventually will seek liquidity events, mostly through M&A sale transactions.
Interestingly, the two states with the highest percentage of their M&A markets attributable to B&D sector sale transactions – Minnesota and North Dakota – are also the leading states, by far, with respect to transactions per capita. If there is a connection, it might be that strong economies (with North Dakota benefiting from its surging fracking industry) and strong M&A markets go hand-in-hand, and strong economies support the development and flourishment of B&D companies, which tend to be less capital intensive, less prone to foreign competition, and less dependent on fashion trends. Hence, B&D companies tend to be attractive acquisition candidates – particularly for financial buyers.
Finally, as shown above (in the table “Annual Growth Rates – M&A Transactions”), over the past five years, corporate sales within the other states of the Northland have exceeded those in Minnesota. Going forward, however, now that the above-described deferred-sale and cycle-fear effects have subsided, we would expect the relatively high growth rates of the states other than Minnesota, particularly of the agriculture- and energy-market dependent Dakotas, to return to the norm. In this environment, Minnesota will likely become an even more important driver of M&A growth in the Northland region.
